
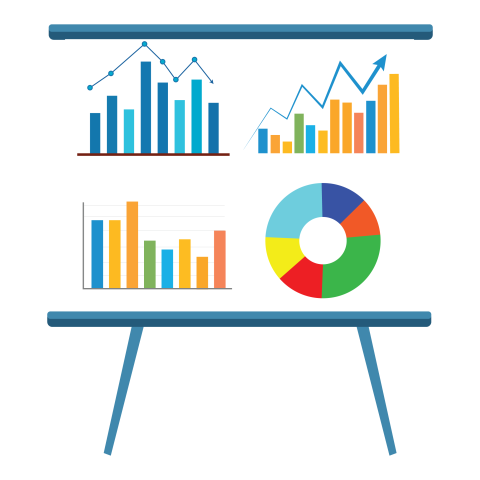
Financial Growth Analysis Presentation Template
This image displays a financial growth and analytics presentation board PNG with colorful bar charts, line graphs and circular diagrams. It symbolizes business growth, market trends, statistics and performance analysis. Good for financial reports, corporate presentations, investment planning, analytics dashboards and professional data visualization related to business and economics.
Similar Photos

Business Presentation Background Images
by Waryhub

Analytics Report Dashboard Flat Design PNG Illustration
by Waryhub

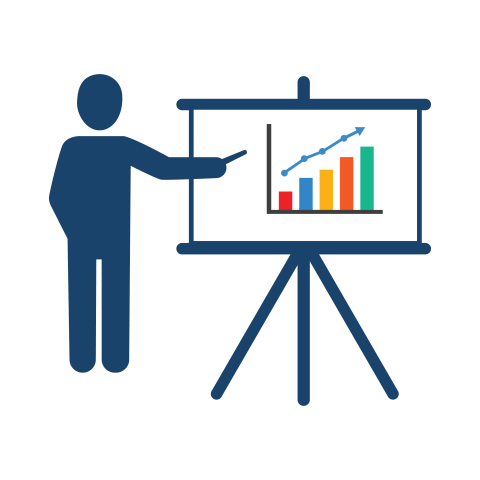
Business Presentation Team Analyzing Growth Charts PNG Illustration
by Waryhub

Business presentation with growth png images
by Waryhub
Website Analytics Interface Flat Vector PNG Illustration
by Waryhub

Free business presentation board png
by Waryhub
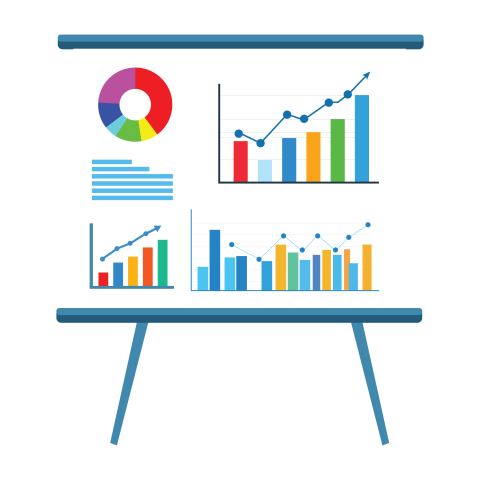
Free business presentation board png background
by Waryhub
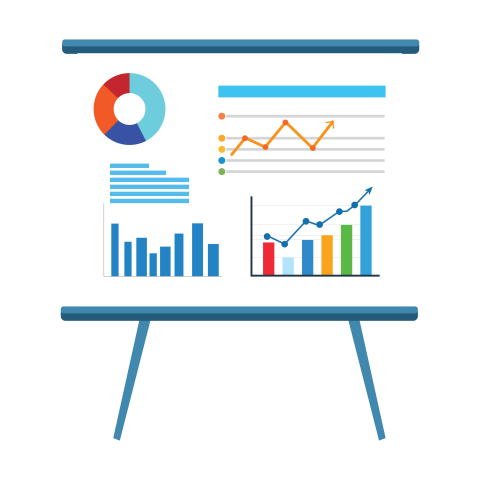
Business Presentation Board PNG For Professionals
by Waryhub

Business presentation board png
by Waryhub

Business Presentation Board PNG Download
by Waryhub

Waryhub
2,419 Photos
-
95
-
0
-
0
License and Use
Free for personal use Attribution required- Details
- Photo #3434
- Published on Jan 30, 2026
- Photo type PNG
- Resolution 2500x2500
- Category Business
- Subcategory Presentation Board
- File size 87.7kB